
Spari is an application that enables travellers to keep track of their spendings while travelling.
UI Design / UX Research
2017, June - August
Travelling can be an expensive hobby. Therefore, allowing travellers to be able to keep track of their spending would allow travellers to enjoy their trip to the fullest. Introducing Spari, a budgeting app for frequent and casual travellers. With Spari, travellers should be secured and stress-free about their trips.
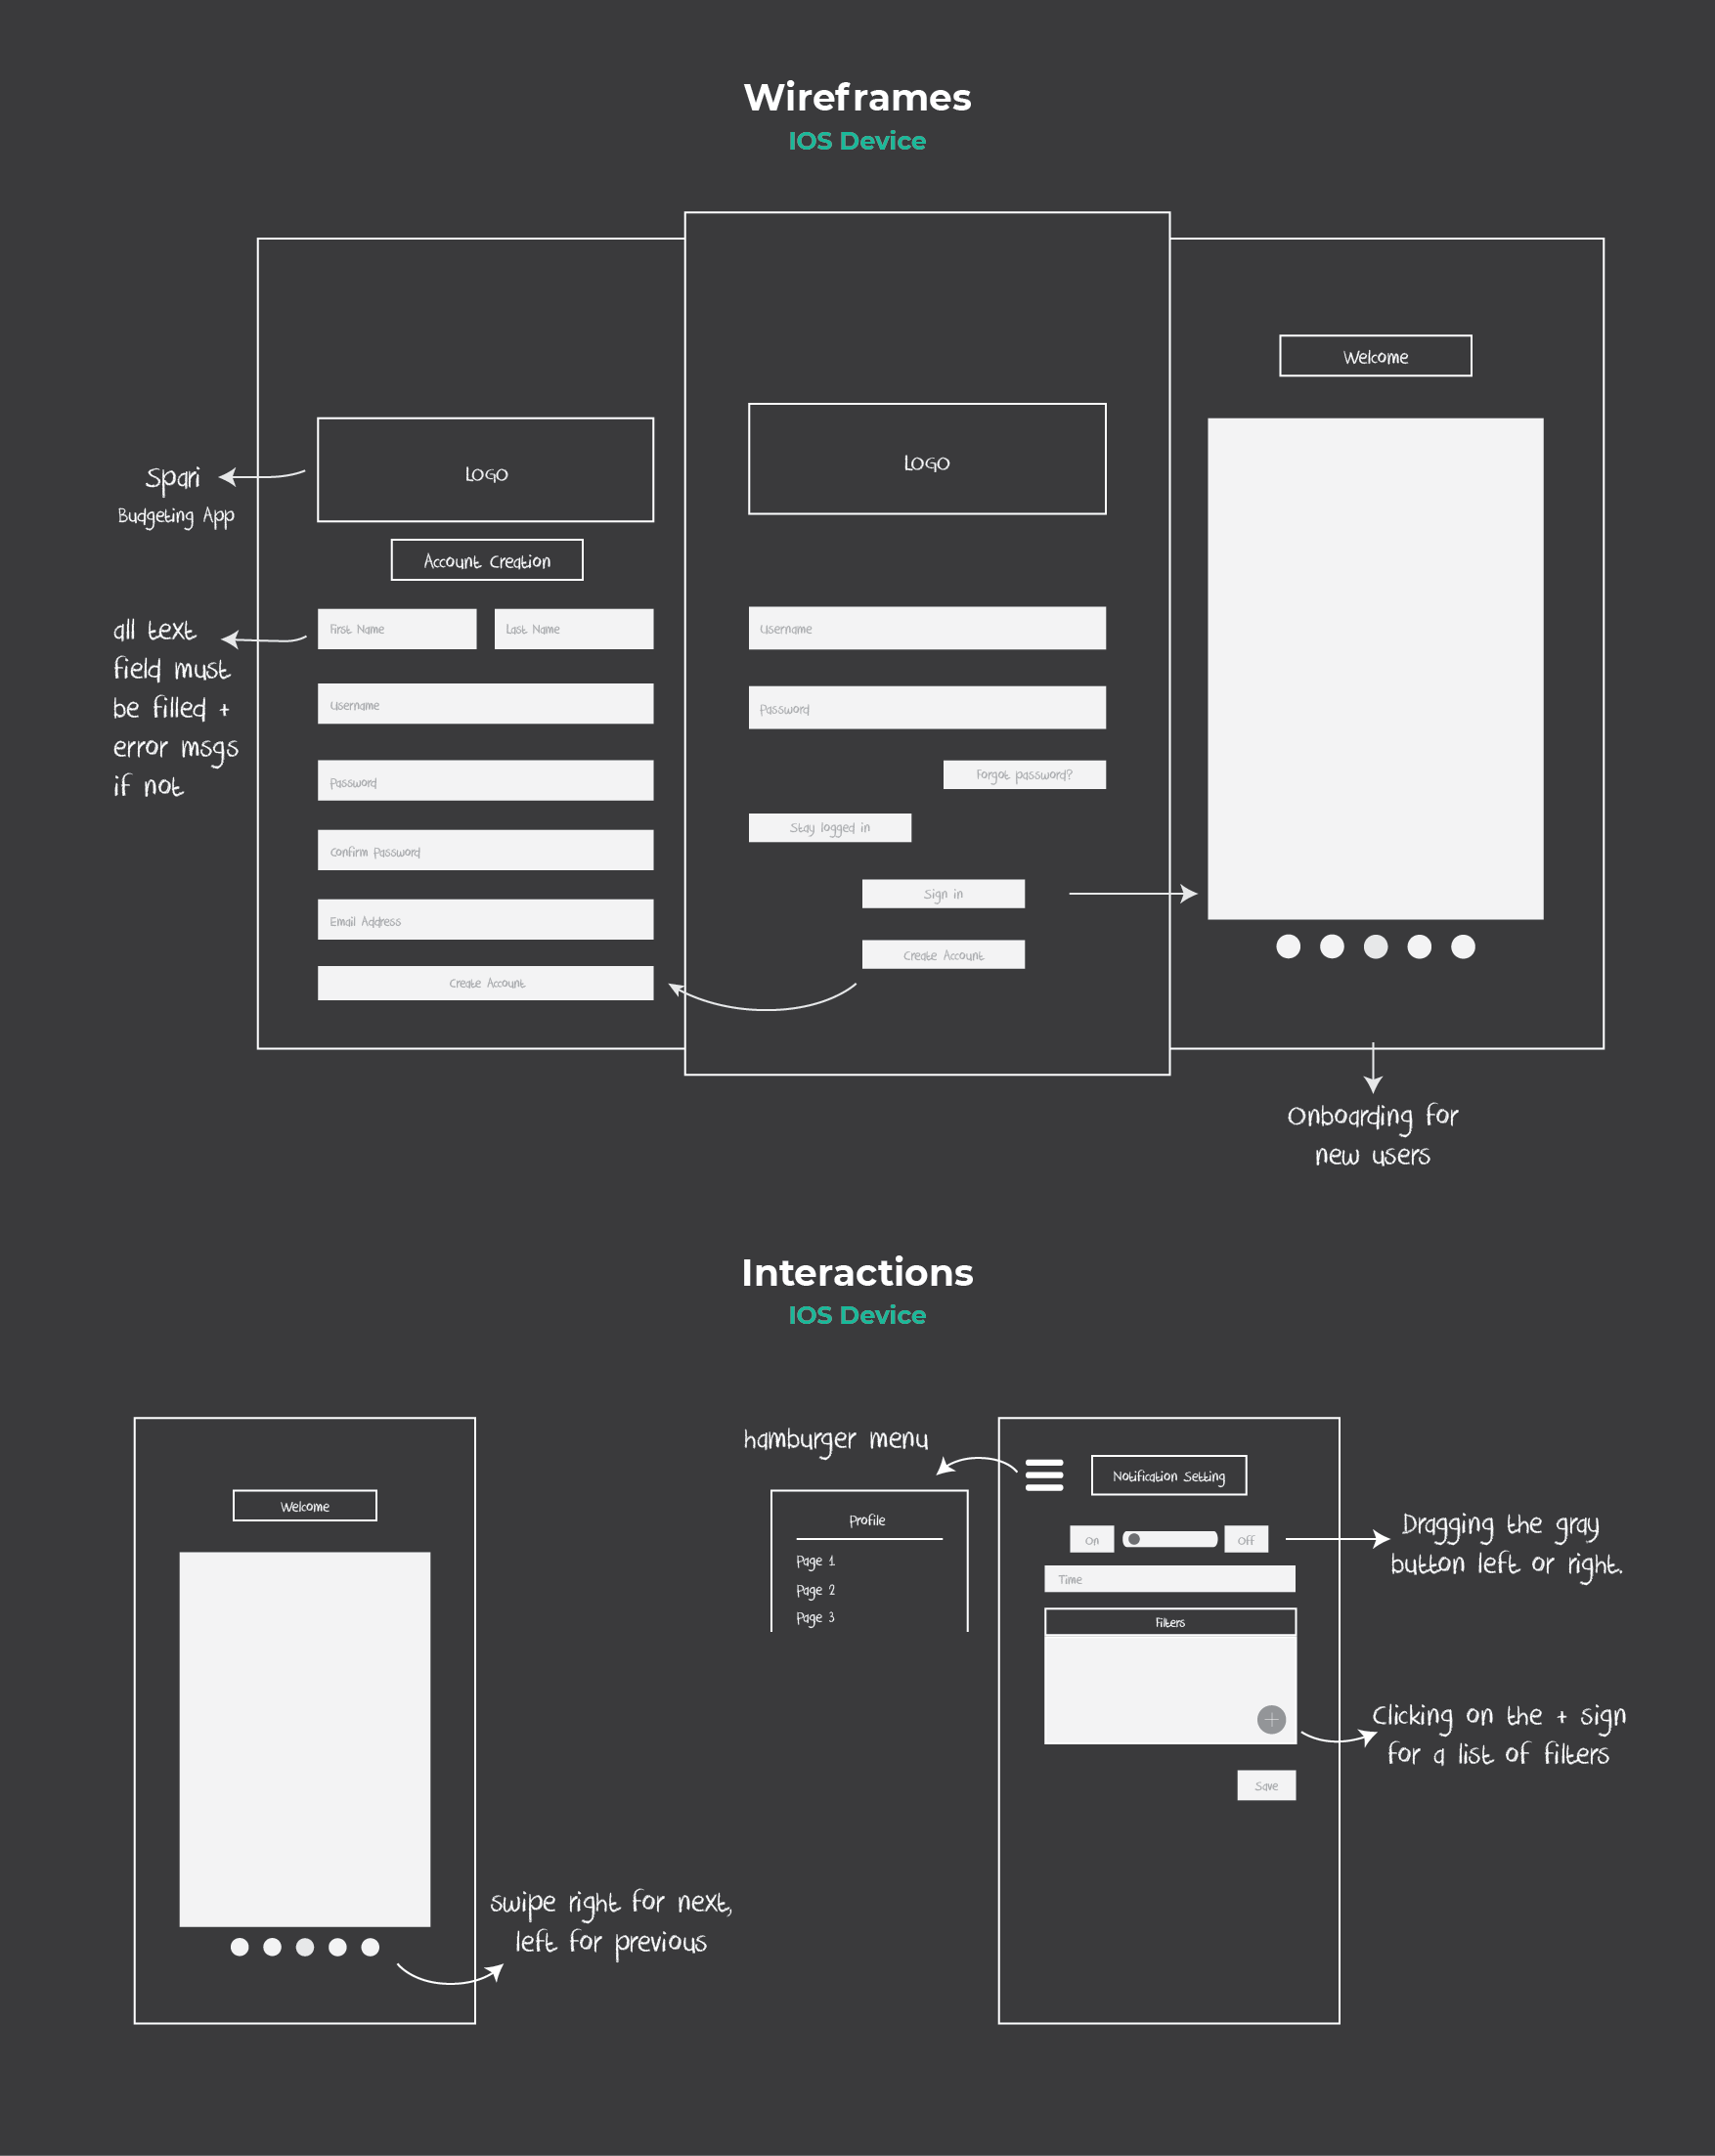
Tourists often use one-hand interaction during outdoor activities. Therefore, this stage focused on some of the interactions and notification settings.
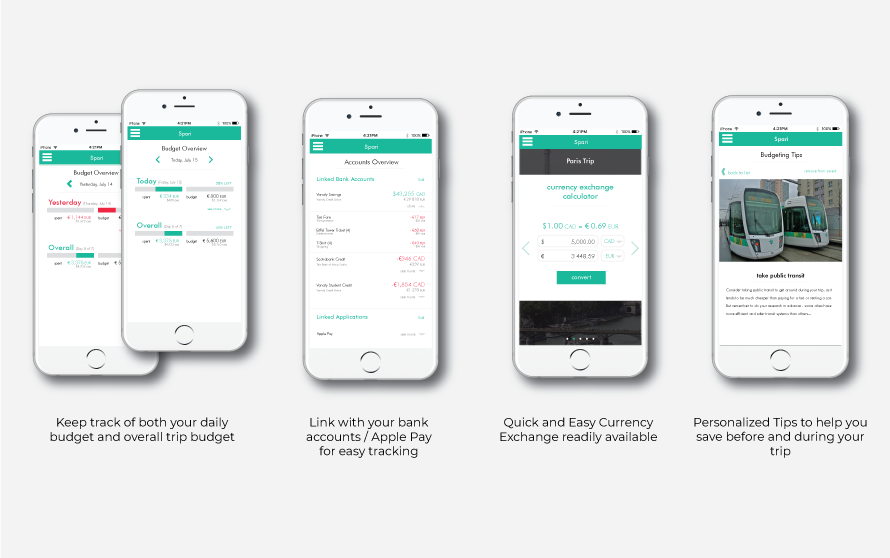
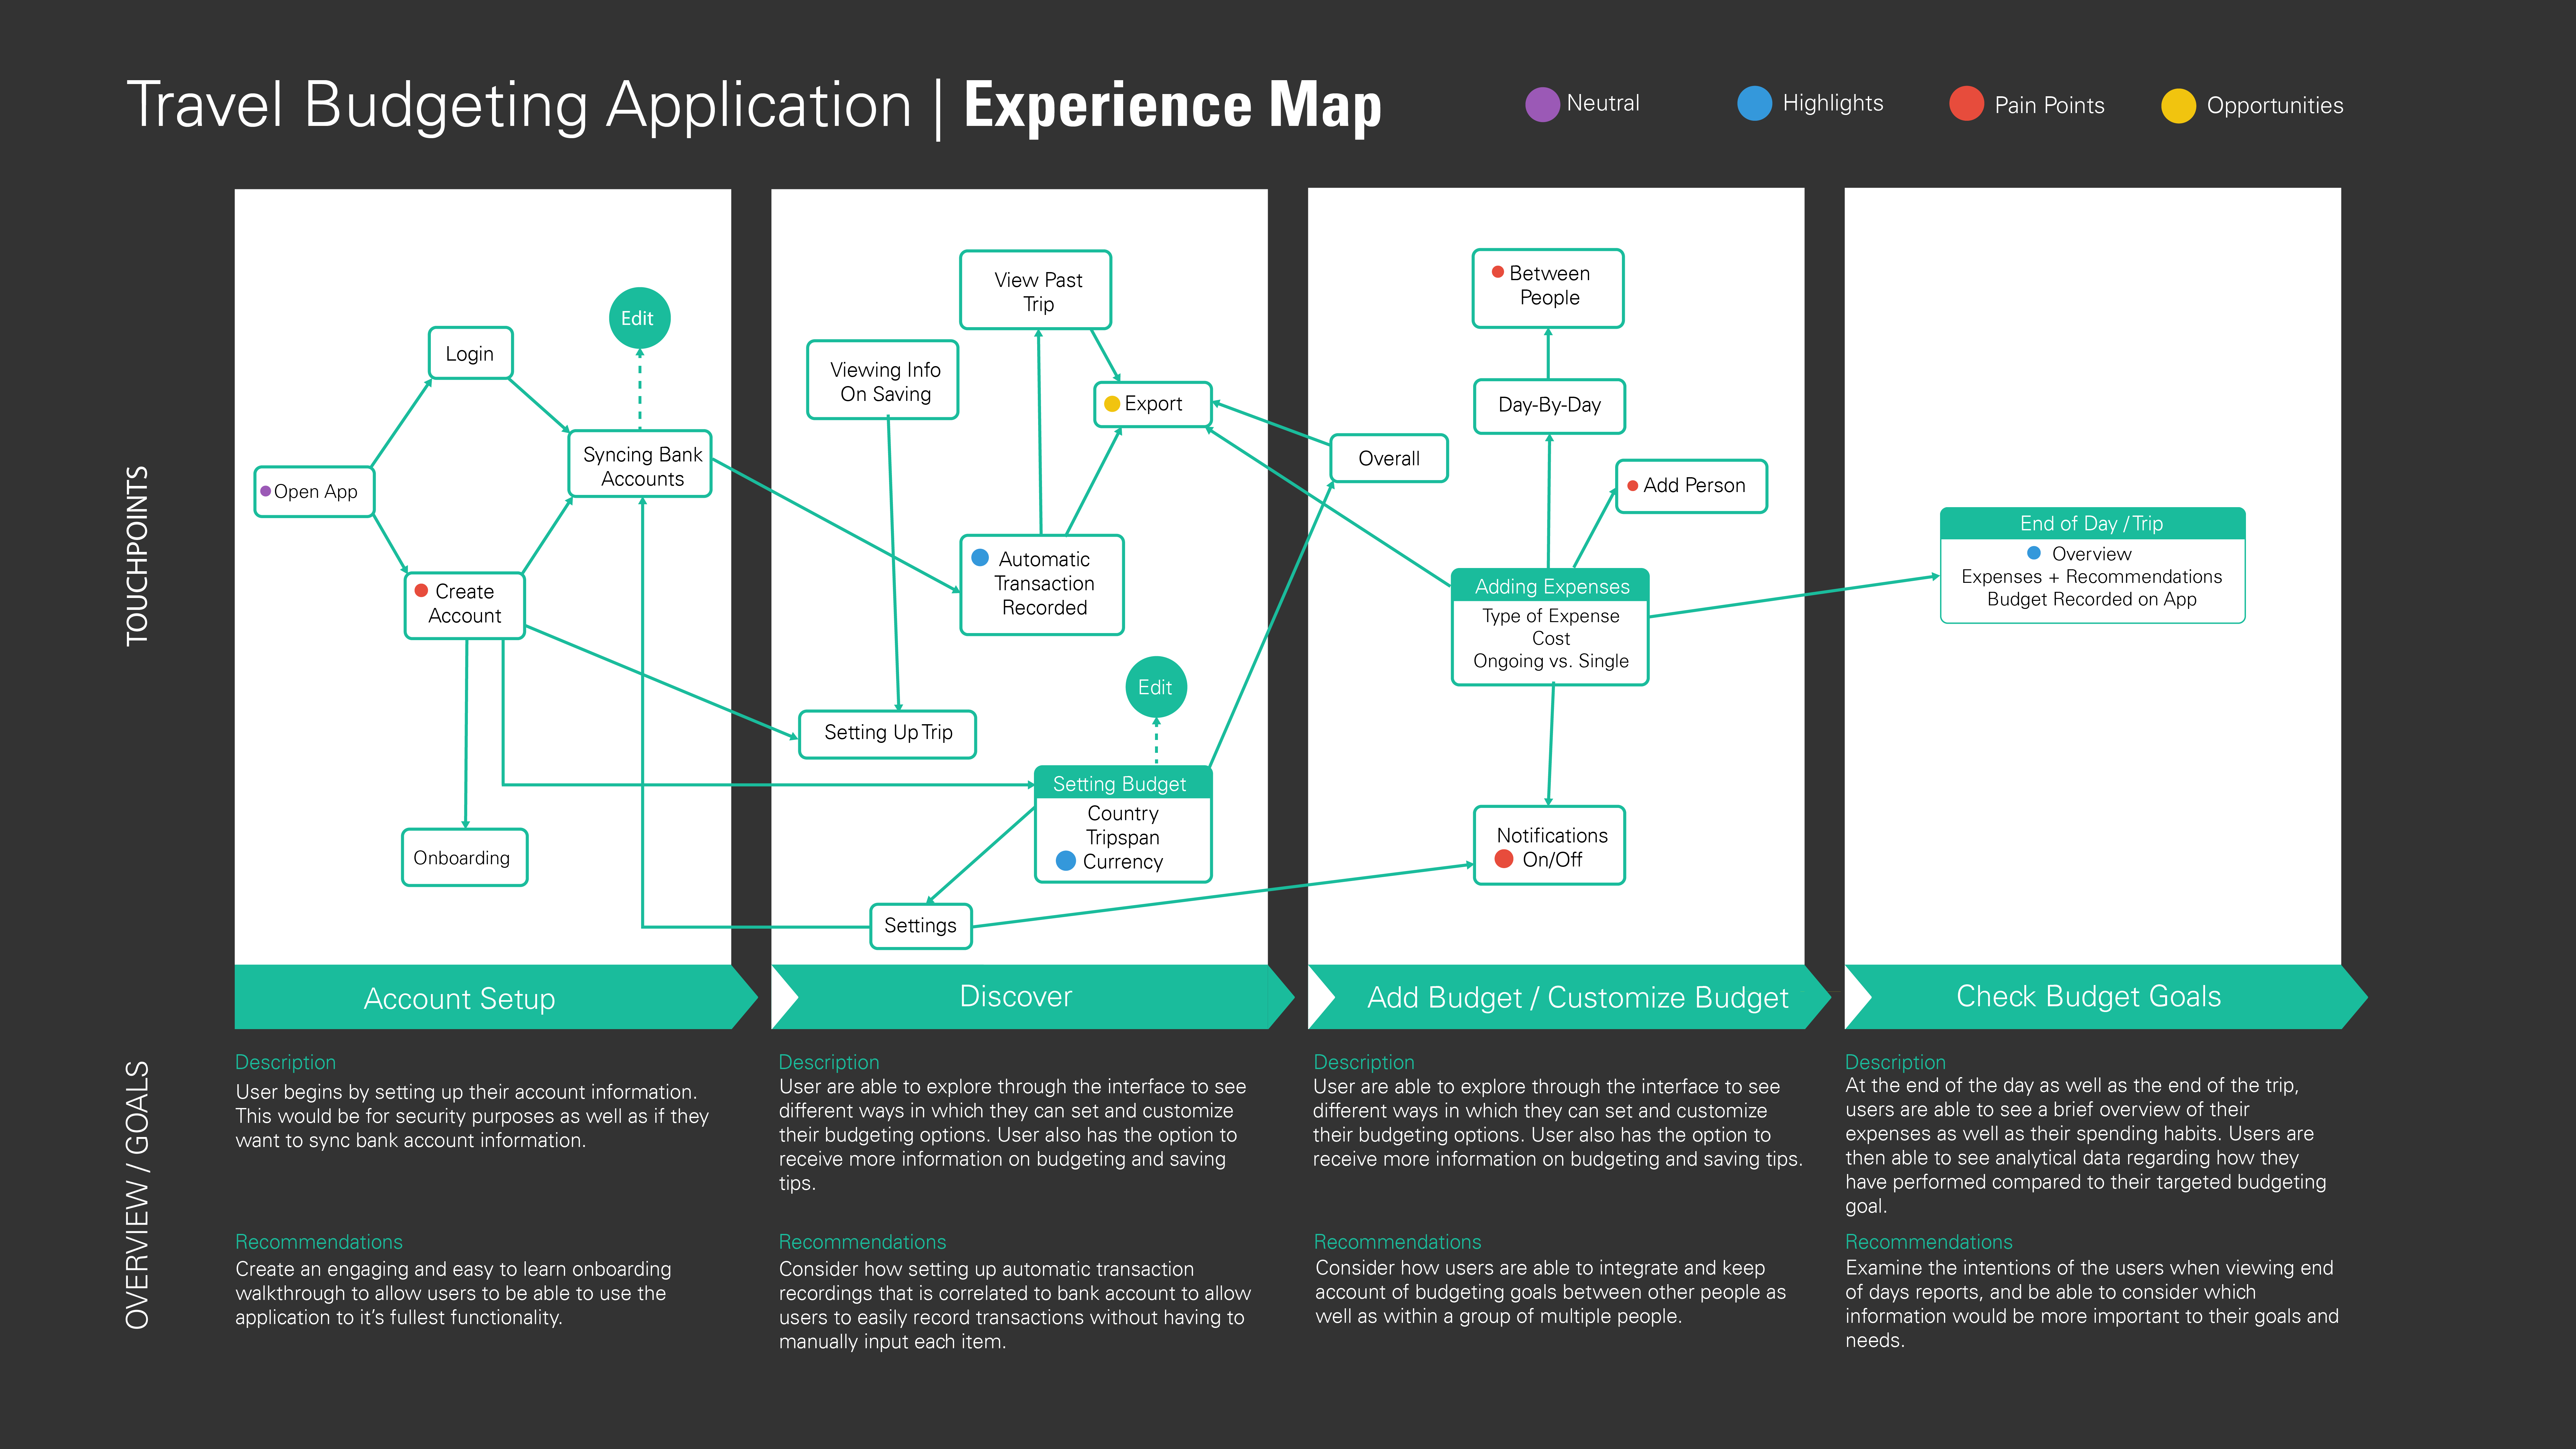
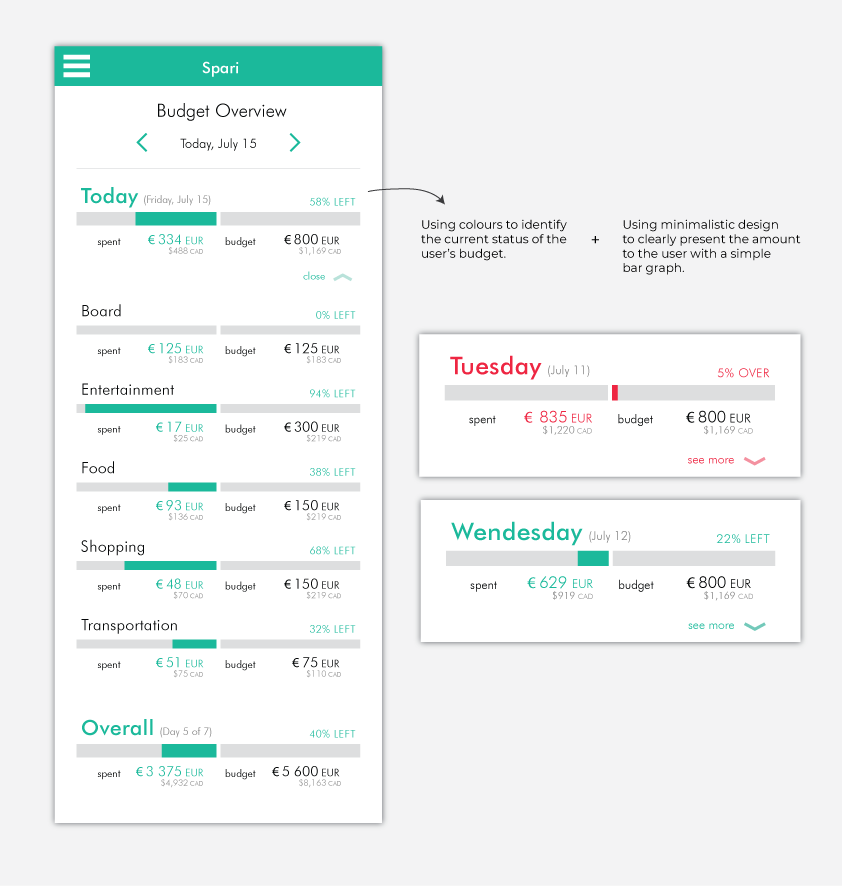
Designing a budgeting app required various research and discovery on the needs of travellers and consumers. The first thought was using a minimalistic design and layout to present the information directed towards the user. For example, the numbers for the money is one of the most important elements in the app, reducing images and increase infographics result in a clear and faster presentation of those numbers towards the user. With the help of colours, the users should be able to quickly open up Spari and identify their current budget status while travelling or purchasing.
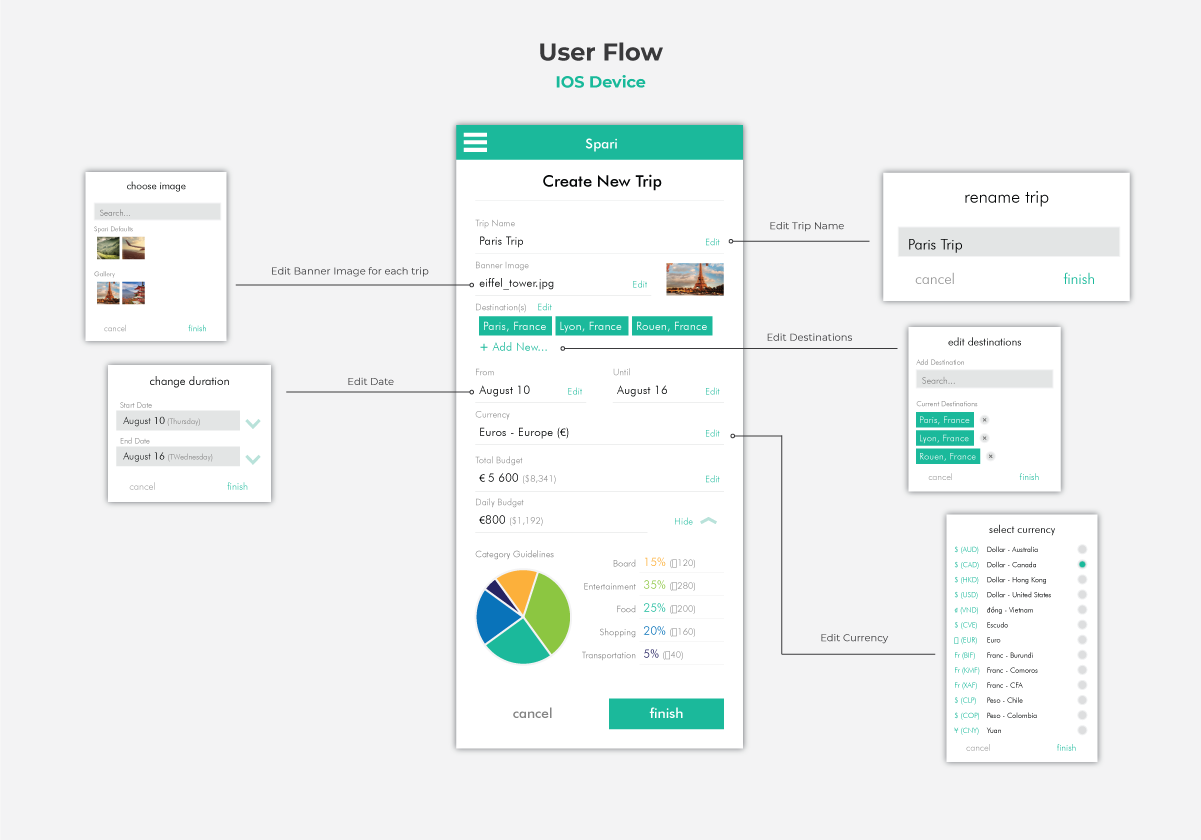
The project was very fun to work with and it taught me a lot of things that I wouldn’t have thought of from the beginning. For example, there is a lot of research and thoughts at the early stage of development to understand what the user needs to avoid putting unnecessary features and interactions to block the users from achieving their goal. One of the challenges that the team faced was the amount of information that should be presented to the users and how would the app use the user interface to present them. Due to the amount of information and numbers in Spari, we don’t want users to be overwhelmed by the amount of information they see. Therefore, using infographics to visually present those numbers and information to the users was a great way to not only reduce the information that the users have to read but also allow the users to quickly gather the data they need.